Foundation F03 · Review draft
A picture of numbers
Read bar charts and line graphs, and let the mean stand for the whole set.
Suggested pace: 35–50 minutes, at your pace. This is an estimate, not a time limit.
The question
A tea stall owner writes down how many cups she sells each day. On Sunday evening she has seven numbers in her notebook: 12, 15, 9, 18, 21, 30, 21. Which day was her busiest? Was the week mostly getting better or worse?
You can answer by staring at the seven numbers, but it takes effort. Draw the same numbers as bars on a page and the answers jump out in one glance. This lesson teaches how to read and draw the two graphs you will meet most: bar charts, which compare categories, and line graphs, which show change over time. It ends with the mean, the single number that stands for a whole set.
By the end, you should be able to read a value from a bar chart or a line graph; compare two values and say by how much they differ; describe how a line moves (rising, falling, flat, steep, gentle); and find the mean of a small data set and check that it is plausible.
You need only addition, subtraction and division with whole numbers. Work on paper. Attempt each question before opening its solution.
Starting check
D1. From the stall owner’s numbers (12, 15, 9, 18, 21, 30, 21), which day’s number is the largest?
D2. What is 15 − 9?
D3. What is the total of the seven numbers?
D4. If you divide the total by 7, what do you get?
Check the starting questions
D1: 30. D2: 6. D3: 126. D4: 18. If D3 or D4 took effort, that is exactly the skill this lesson uses, so practise them once more on paper before moving on. Nothing else here needs more than careful addition, subtraction and one division.
Idea 1: tables give exact values, graphs give shape
A table lists every value exactly. A graph draws the same values so your eyes can compare them at once. Neither is better in every situation: when you need the exact number, use the table; when you need to see which is biggest, what is changing, or what is unusual, use the graph. Good readers move between the two.
Idea 2: axes, labels and scale
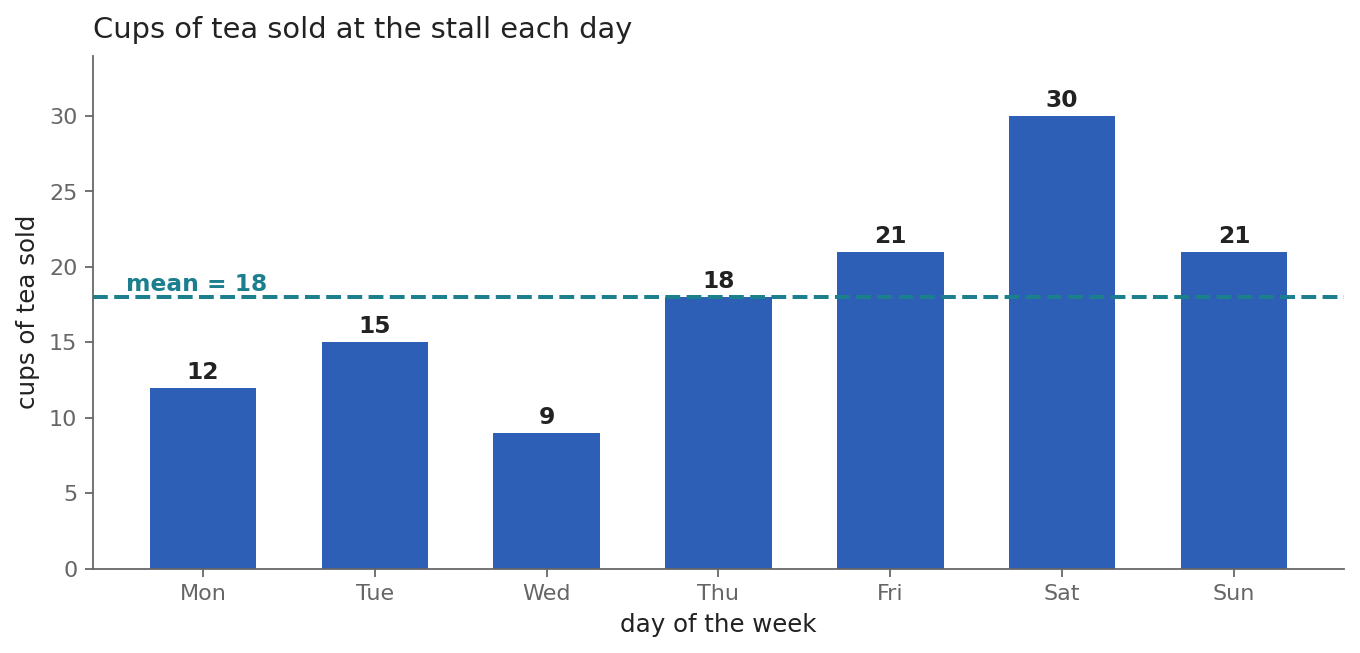
Every honest graph rests on two axes. The horizontal axis (the x-axis) names the categories, here the days. The vertical axis (the y-axis) carries the scale, the equal steps the values are measured in, here cups of tea in steps of 5. To read a bar, go from its top across to the y-axis and read the number. A graph without axis labels or a scale cannot be trusted, because you cannot tell what the heights mean.
Worked example 1: reading a value
How many cups did the stall sell on Tuesday?
Read the bar: find Tuesday on the x-axis, go up to the top of its bar, then across to the y-axis. The top lines up with 15. The stall sold 15 cups on Tuesday.
Worked example 2: comparing two values
How many more cups were sold on the busiest day than on the quietest day?
Compare: the tallest bar is Saturday at 30; the shortest is Wednesday at 9. The difference is 30 − 9 = 21 cups. This difference between the largest and smallest values is called the range.
Your turn A: how many more cups were sold on Friday than on Wednesday?
Check your attempt
Explanation: Friday is 21 and Wednesday is 9, so the difference is 21 − 9 = 12 cups. Reading both bars first and subtracting second is the habit that prevents slips.
Idea 3: a line graph shows change over time
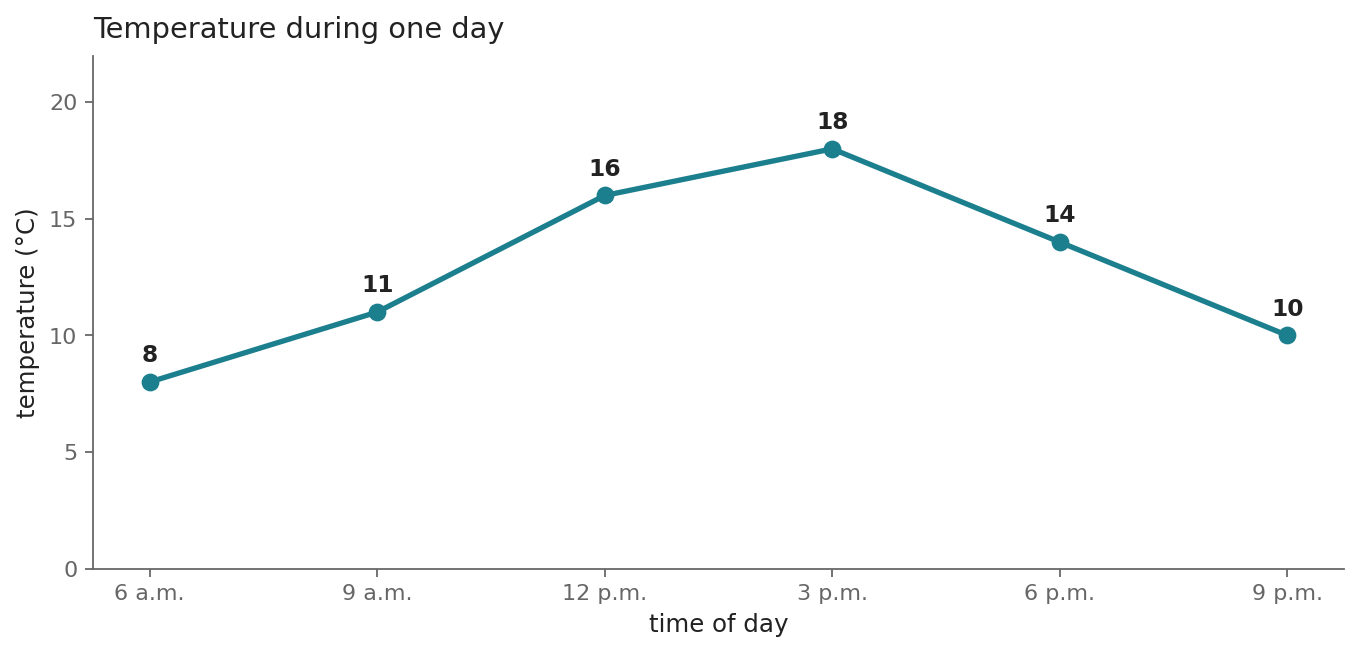
When the x-axis is time and you care about change, join the points with a line. A line graph rises when the value increases, falls when it decreases, and stays flat when nothing changes. The steeper the line, the faster the change: a steep climb means the value grew quickly; a gentle climb means it grew slowly.
Worked example 3: reading a line graph
What was the temperature at noon?
Read the point: find 12 p.m. on the x-axis, go up to the line, then across to the y-axis. The point lines up with 16, so the temperature at noon was 16°C.
Worked example 4: when did the temperature change fastest?
Between which two readings did the temperature change fastest, and by how much?
Compare the steps: 6 a.m. to 9 a.m.: 11 − 8 = 3°C rise. 9 a.m. to 12 p.m.: 16 − 11 = 5°C rise. 12 p.m. to 3 p.m.: 18 − 16 = 2°C rise. 3 p.m. to 6 p.m.: 18 − 14 = 4°C fall. 6 p.m. to 9 p.m.: 14 − 10 = 4°C fall. The biggest step is 5°C, between 9 a.m. and 12 p.m., which is also the steepest part of the line. The graph and the arithmetic agree.
Your turn B: between 6 a.m. and 3 p.m., by how much did the temperature rise in total?
Check your attempt
Explanation: from 8°C to 18°C, so the rise is 18 − 8 = 10°C. You can also add the three rises: 3 + 5 + 2 = 10°C. Both routes agree, which is a useful check.
Idea 4: the mean stands for the whole set
Seven numbers are hard to hold in your head. The mean replaces them with one number that shares the total equally: add all the values, then divide by how many values there are. For the tea stall, the mean is the answer to “if every day had sold the same number of cups, and the week’s total stayed the same, how many cups would each day have sold?”
Worked example 5: the mean of the week
Find the mean daily sales of the tea stall.
Share the total equally: the total is 12 + 15 + 9 + 18 + 21 + 30 + 21 = 126 cups over 7 days. The mean is 126 ÷ 7 = 18 cups per day. Now check plausibility: the mean must sit between the smallest value (9) and the largest (30). It does. A mean outside that range always means an arithmetic mistake. The dashed line on the bar chart marks this mean: three days sold less than 18, one day sold exactly 18, and three days sold more.
Your turn C: a second stall sold 10, 14, 12, 16, 18 cups from Monday to Friday. Find its mean daily sales.
Check your attempt
Explanation: the total is 10 + 14 + 12 + 16 + 18 = 70 cups over 5 days, so the mean is 70 ÷ 5 = 14 cups per day. It sits between the smallest (10) and the largest (18), as it must.
Interactive practice
The graph plotter draws the stall’s week as bars you can change. Raise or lower any day with the buttons and watch two things: the shape of the week changes, and the dashed mean line moves, because the mean shares the new total equally. Try to make every day reach the mean line exactly. That is the picture of “the mean shares the total equally”.
Independent practice
Answer on paper from the two graphs and the data sets in this lesson. Open each explanation only after your own attempt.
P1. How many cups did the stall sell on Thursday?
Check your attempt
Explanation: 18 cups. Find Thursday on the x-axis, go up to the top of the bar, then across to the y-axis.
P2. On which day were sales lowest, and how low?
Check your attempt
Explanation: Wednesday, 9 cups. The shortest bar on the chart.
P3. Which two days had equal sales, and how many cups?
Check your attempt
Explanation: Friday and Sunday, 21 cups each. Their bars are the same height.
P4. What is the range of the week’s sales?
Check your attempt
Explanation: the largest value is 30 (Saturday) and the smallest is 9 (Wednesday), so the range is 30 − 9 = 21 cups.
P5. At 6 p.m., what was the temperature?
Check your attempt
Explanation: 14°C. Find 6 p.m. on the x-axis, go up to the line, then across to the y-axis.
P6. When was the temperature highest, and how high?
Check your attempt
Explanation: at 3 p.m., 18°C, the peak of the line.
P7. Between 3 p.m. and 9 p.m., by how much did the temperature fall?
Check your attempt
Explanation: from 18°C to 10°C, so it fell by 18 − 10 = 8°C.
P8. Describe the temperature line between 12 p.m. and 3 p.m. in one sentence using “rising”, “falling”, “flat”, “steep” or “gentle”.
Check your attempt
Explanation: it is still rising, but gently: only 2°C in three hours, compared with 5°C in the previous three hours.
P9. Find the mean of the six temperature readings.
Check your attempt
Explanation: the total is 8 + 11 + 16 + 18 + 14 + 10 = 77, and 77 ÷ 6 = 12.833…, about 12.8°C. It sits between the lowest reading (8) and the highest (18), as it must. Means are often not whole numbers.
P10. The stall owner says: “Every day this week was better than the day before.” Is she right? Use the graph, not her memory.
Check your attempt
Explanation: no. Sales fell from 15 on Tuesday to 9 on Wednesday, and from 30 on Saturday to 21 on Sunday. The week mostly climbed, but not every day.
P11. Without changing the total, how would the mean change if Saturday had sold 23 cups instead of 30?
Check your attempt
Explanation: the total would fall by 7 cups, from 126 to 119, and the mean would fall by 1, from 18 to 119 ÷ 7 = 17 cups. Sharing a smaller total equally gives a smaller share.
P12. In one or two sentences, explain when a line graph is a better choice than a bar chart.
Check your attempt
Explanation: a line graph suits values that change over time, because the line’s rise, fall and steepness show the change directly. A bar chart suits comparing separate categories, such as days or products, where the height of each bar carries the value.
Check, return and extend
Exit check
E1. On a bar chart, how do you read the value of one bar?
E2. What does a flat part of a line graph mean?
E3. How do you find the mean of a data set?
E4. What is the quickest plausibility check on a mean?
Check the exit questions
E1: go from the top of the bar across to the y-axis and read the number. E2: the value is not changing during that time. E3: add all the values and divide by how many values there are. E4: the mean must sit between the smallest and largest values; outside that range there is a mistake.
For this lesson, move on when you can read values from both graph types, find a difference and a range, describe a line’s movement in words, and compute and check a mean. This is a suggested learning rule, not an official pass mark.
Return review
Tomorrow: without looking back, write the mean of the stall’s week and the day with the lowest sales. Answers: 18 cups; Wednesday with 9.
In about one week: collect seven numbers from your own life, for example minutes of study each day for a week. Draw them as bars, mark the mean with a dashed line, and write one sentence about the shape.
Extend beyond the lesson
Later foundation lessons build on this one: powers of ten and prefixes, significant figures, and reading misleading graphs whose scales have been stretched or cut. In science subjects the same skills become plotting measurements against each other; in social subjects they become reading charts about population and prices.
Sources and limits
The explanations, examples, diagrams, the interactive plotter and the questions are original. The mathematics is elementary and standard: reading scaled axes, comparing values and sharing a total equally to find the mean. No textbook passage, illustration or question bank is reproduced.
This is not an official paper, teacher-endorsed course or complete chapter. Pie charts, misleading scales and plotting scientific measurements need their own lessons. Spaced review is informed by the IES learning practice guide; the suggested timing is not an optimal schedule proven for every learner. This material has not been reviewed by a qualified NEB teacher.
Revision F03-R1 · Arithmetic checked exactly · 21 November 2026.